Xylorix Toolkit Insider
Overview
The Toolkit Insider allows users to view their model performance in detail with various parameters, as well as see the full list of tests and datasets created using the Insider App.
Get Started
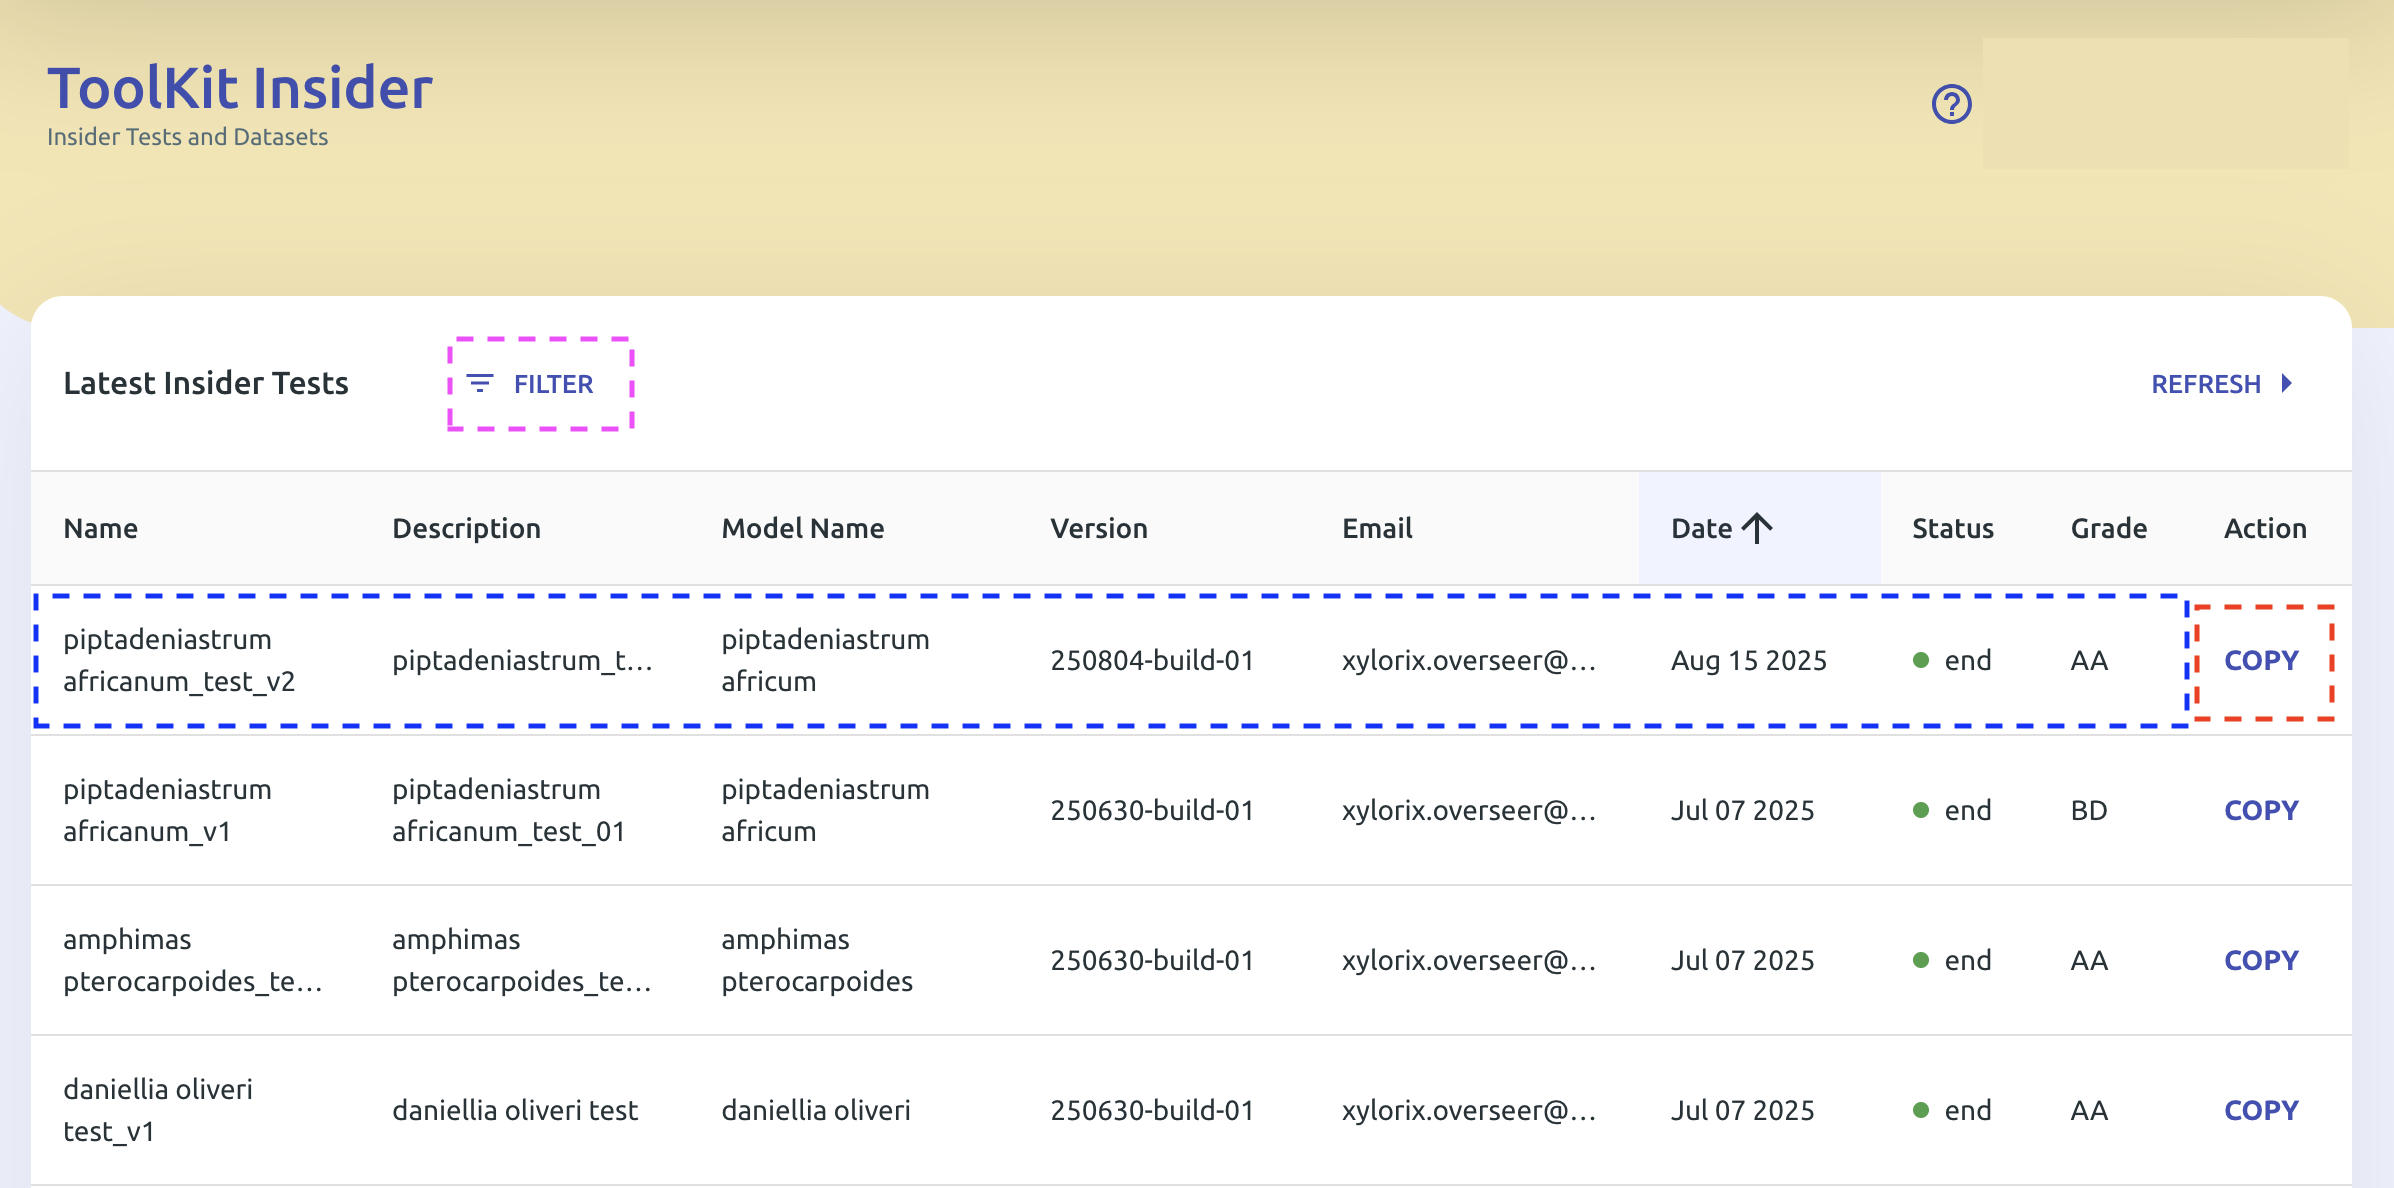
On the Insider main page, you can see the full list of created tests and datasets.
Created tests have different statuses:
| Status | Color | Meaning |
|---|---|---|
| Pending | 🔵 Blue | Created and not finalized yet |
| Finished | 🟢 Green | Finalized and finished processing |
| Error | 🔴 Red | Test not completed |
- Tap on a finalized test (highlighted blue box) to see the detail of the test report.
- Tap on the Filter button (highlighted pink box) to filter tests by model and status.
- Tap on the Copy button (highlighted red box) to create a new test copied from the selected test.
Tests with large amounts of datasets and images may take longer to finalize.
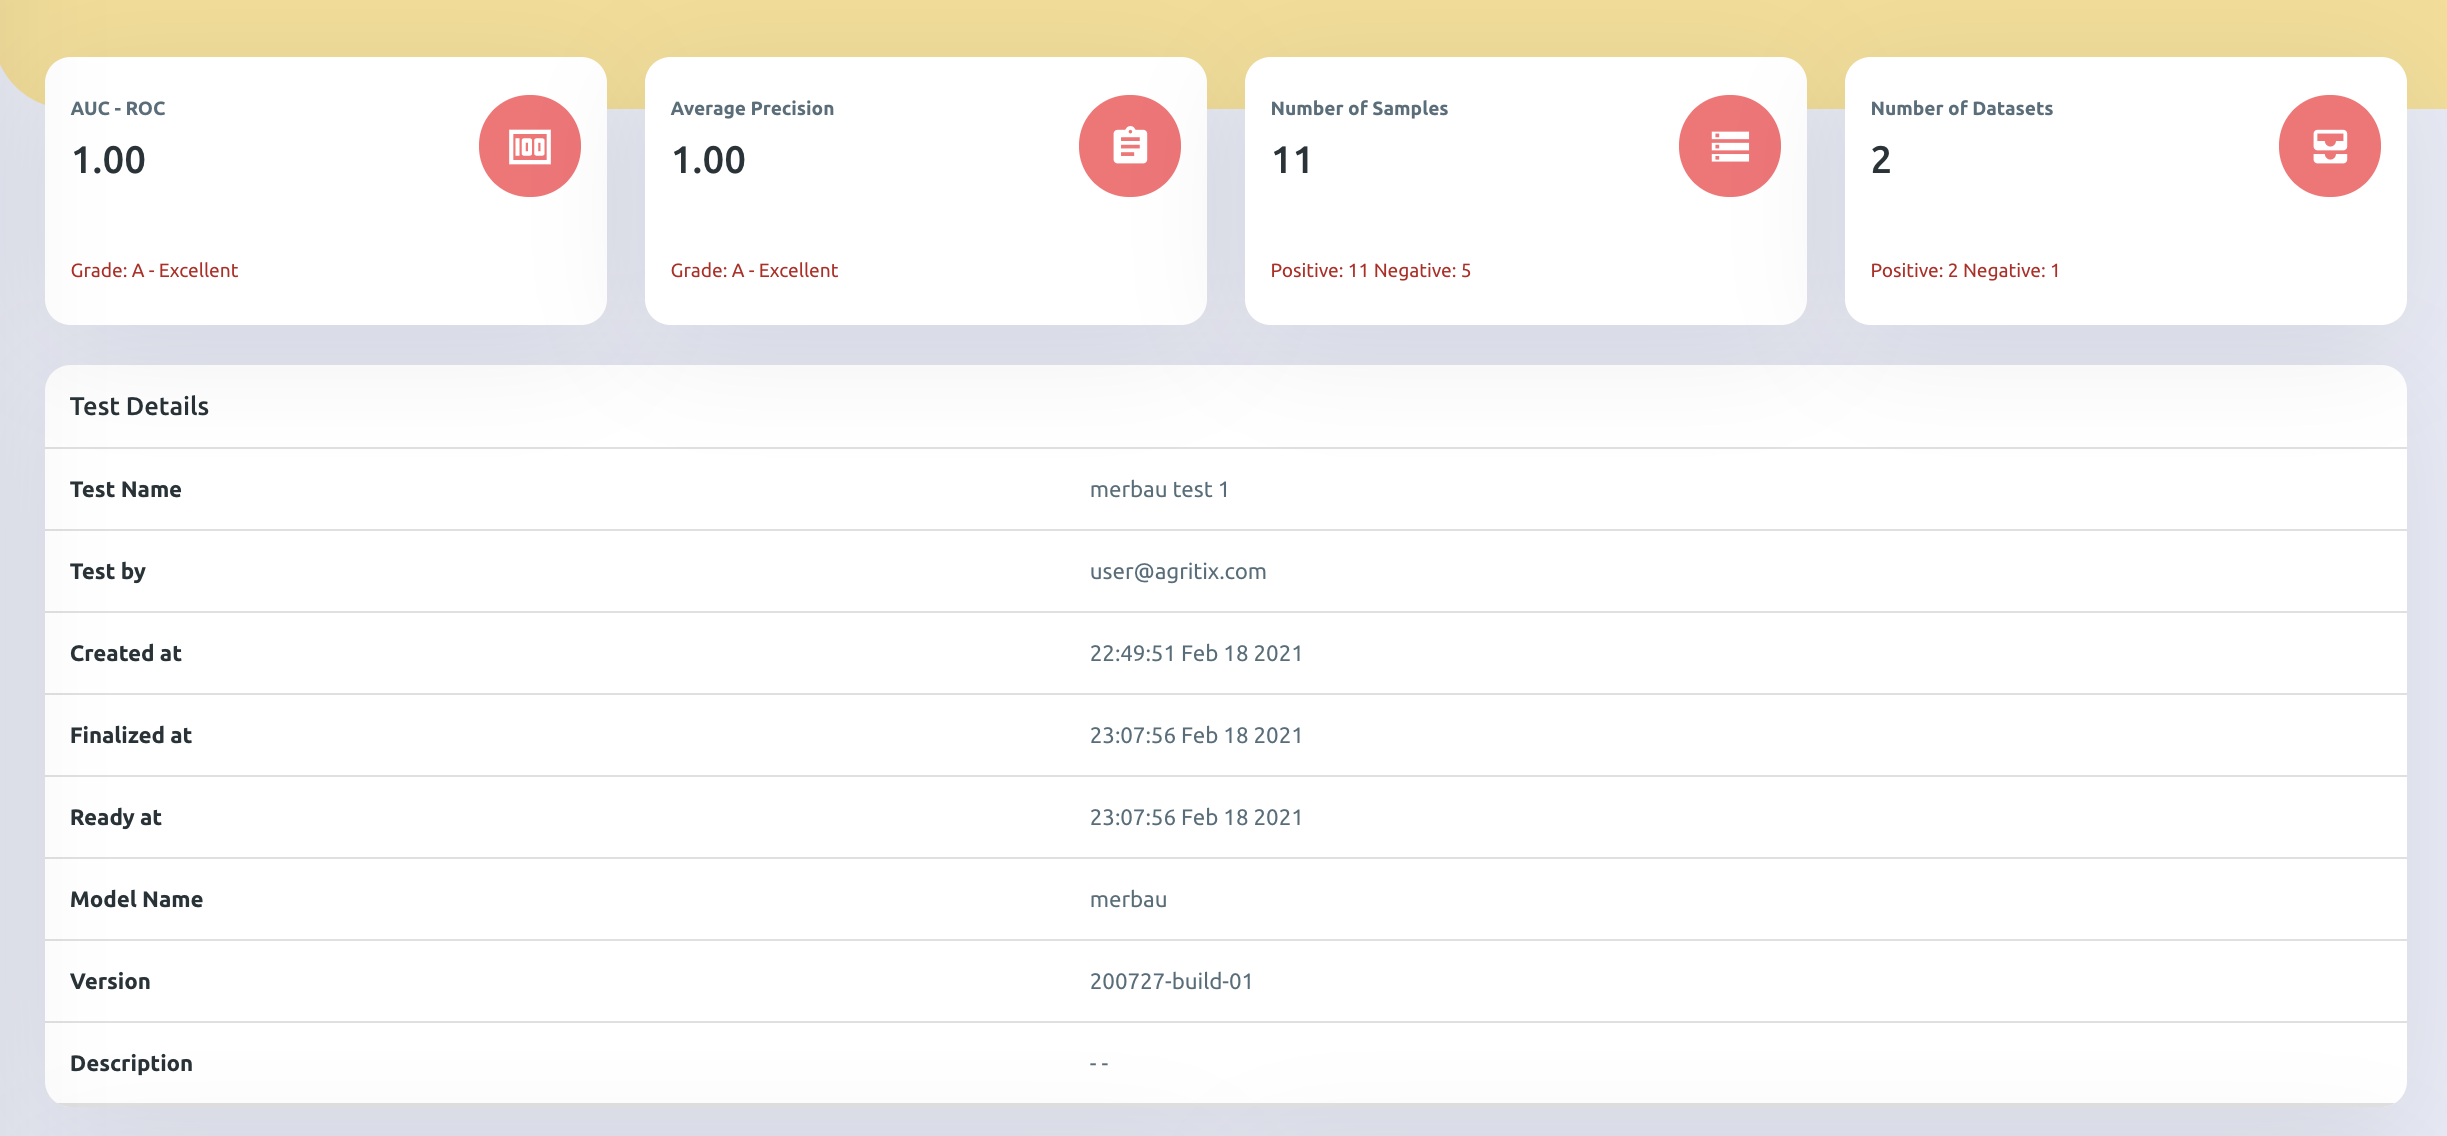
In the test report page shown below, users can find model performance in detail with different metrics. Each metric and its respective role are defined in the following section.
Metrics Definition
AUC-ROC Score
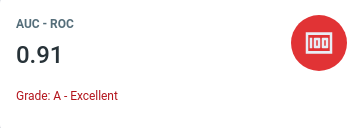
This score represents how good the model is at distinguishing positive and negative images.
- Ranges from 0–1; the higher the AUC-ROC score, the better it is.
- For example, a Balau model with an AUC-ROC score of 0.91 indicates it can distinguish positive and negative images extremely well.
- It is recommended that a model should obtain at least AUC-ROC of 0.8 (Grade B) and above to be considered as good performance.
Average Precision
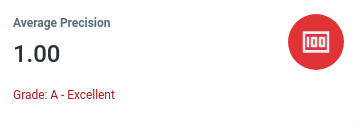
This value represents how accurate the model is at predicting the correct wood images and not mistaking a negative image as positive.
- Ranges from 0–1; the higher the precision value, the better it is.
- For example, a Balau model with an Average Precision of 1.00 indicates that all wood images identified by the model as Balau are actual Balau wood images.
- It is recommended that a model should obtain at least average precision of 0.8 (Grade B) and above to be considered as good performance.
Performance Box Plot
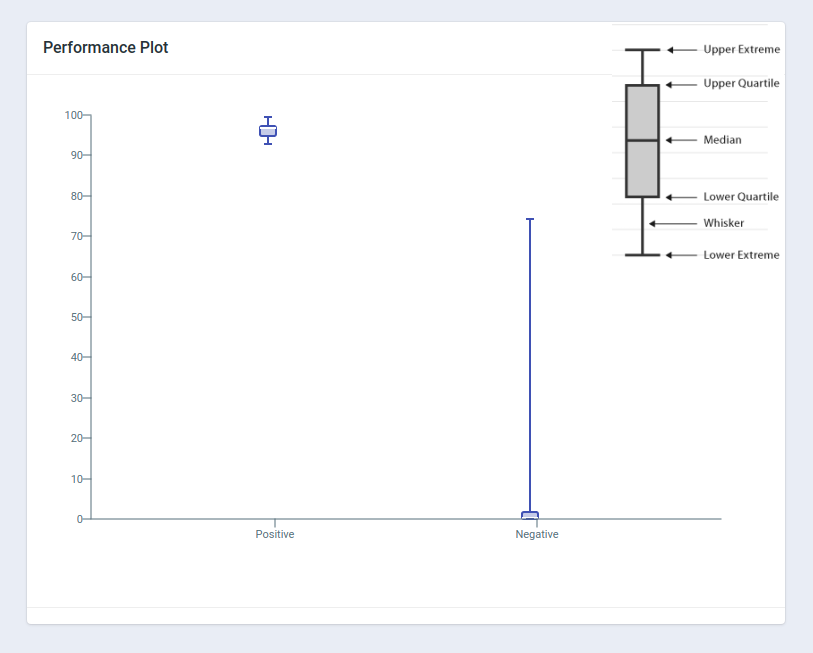
The box plot shows the summary of minimum, first quartile, median, third quartile, and maximum prediction values for both positive and negative images.
In general, a good model should see higher values for positive images and lower values for negative images, with little-to-no overlap between the positive and negative images.
ROC Curve
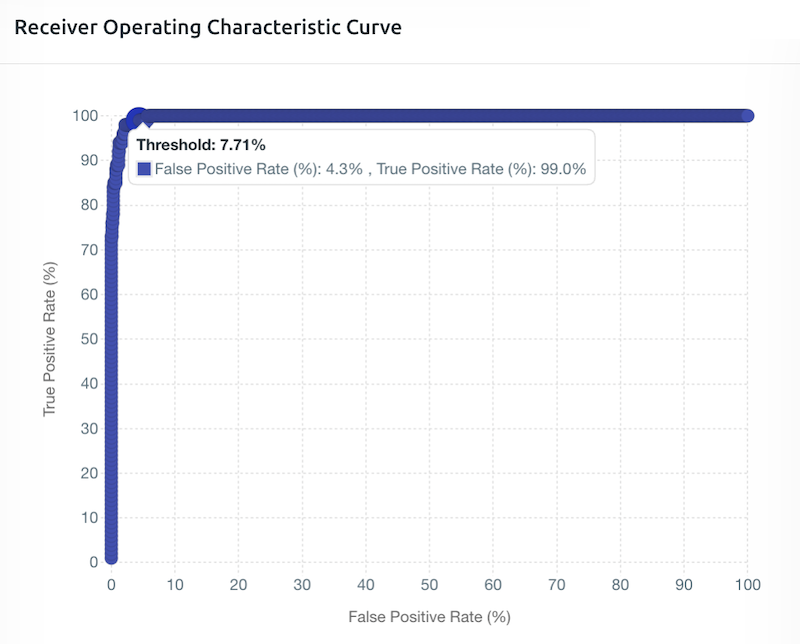
The ROC curve shows how well the model distinguishes positive and negative images at different threshold levels.
In general, the larger the area under the graph (or the more rectangular shaped the graph is at the upper-left corner), the better the performance of the model.
In the example, at a Threshold value of 7.71%, the model correctly identifies 99% of positive images while only misclassifying 4.3% of negative images as positive.
PR Curve (Trade-off Points)

The Precision-Recall (PR) curve is a simple way to see how good a prediction model is at different settings.
In simple terms, the closer the curve hugs the top-right corner, the better the model is. A curve that looks like a perfect square in the top-right corner represents an ideal model (high precision and high recall simultaneously).
F-Score Trade-off Points
| F-Score | Priority | Practical Example |
|---|---|---|
| F-0.5 Score (red dot) | Prioritizing precision (Extra cautious) | Used when all identified timber must be correct and the model must be highly confident. Example: High-stake environment — you only want to flag a timber container if the model is highly confident it is a regulated species. A false positive could lead to reputational and financial repercussions. |
| F-1 Score (green dot) | Balancing precision and recall (Balanced approach) | Used for a general-purpose identification system where both false positives and false negatives are equally managed. Example: General use — a solid balance without excessive lean in either direction. |
| F-2 Score (orange dot) | Prioritizing recall (Extra alert) | Used when missing an identification is very costly, even if it means more false alarms. Example: Border control/illegal logging detection — it is better to over-flag and inspect extra containers than to miss illegal timber during inspections. |
In the example, at a Threshold value of 14.89%, the model achieves the maximum F-1 score of 91.3%, with recall of 94.0% and precision of 88.7%.
Threshold Setting
Setting the threshold is one of the important final steps of model development as it determines how sensitive the model is at predicting positive images during field deployment.
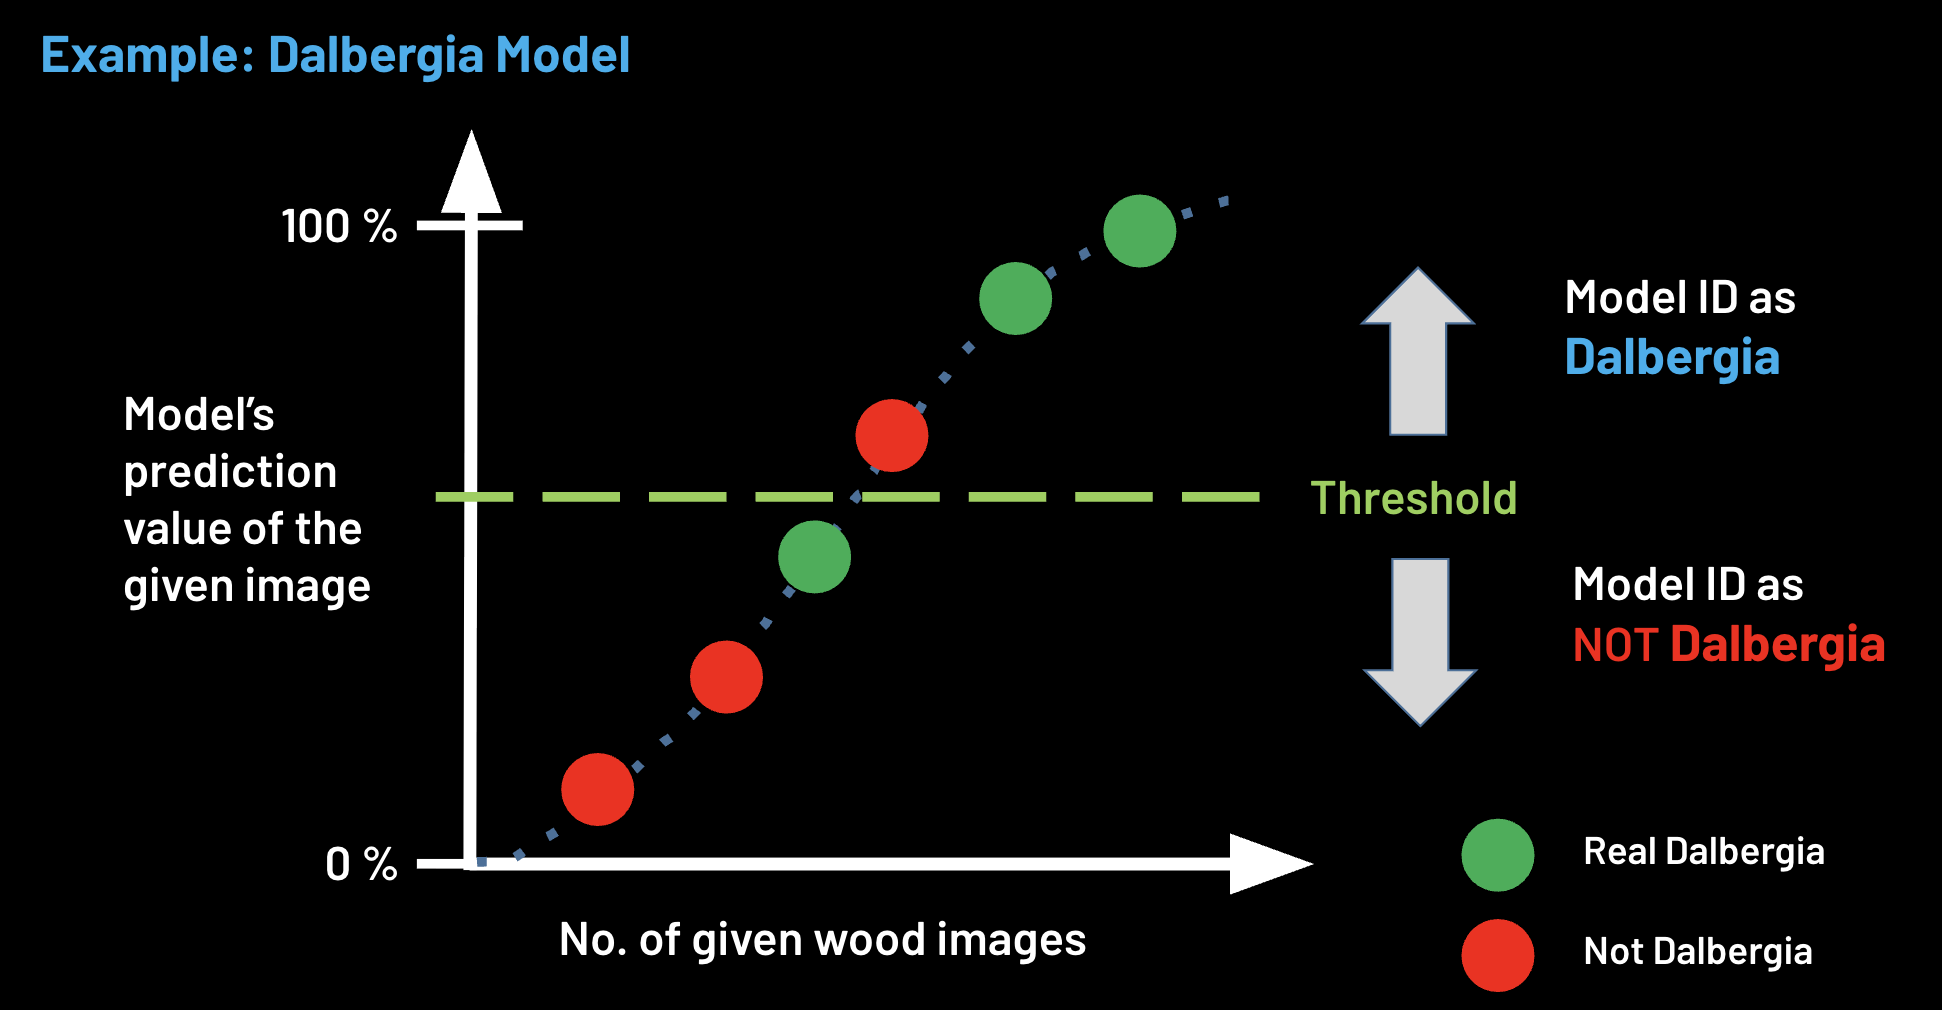
The threshold is a cut-off point for the Xylorix model to convey its prediction probability value as a binary classification result (is species X or is not species X).
In general, the threshold can be set anywhere between 0 to 1 (0–100%). It is important to choose a threshold that balances the trade-off between precision and recall/sensitivity based on the use case.
The appropriate threshold value can also be determined based on the ROC and PR Curves explained above.
Higher Threshold Setting
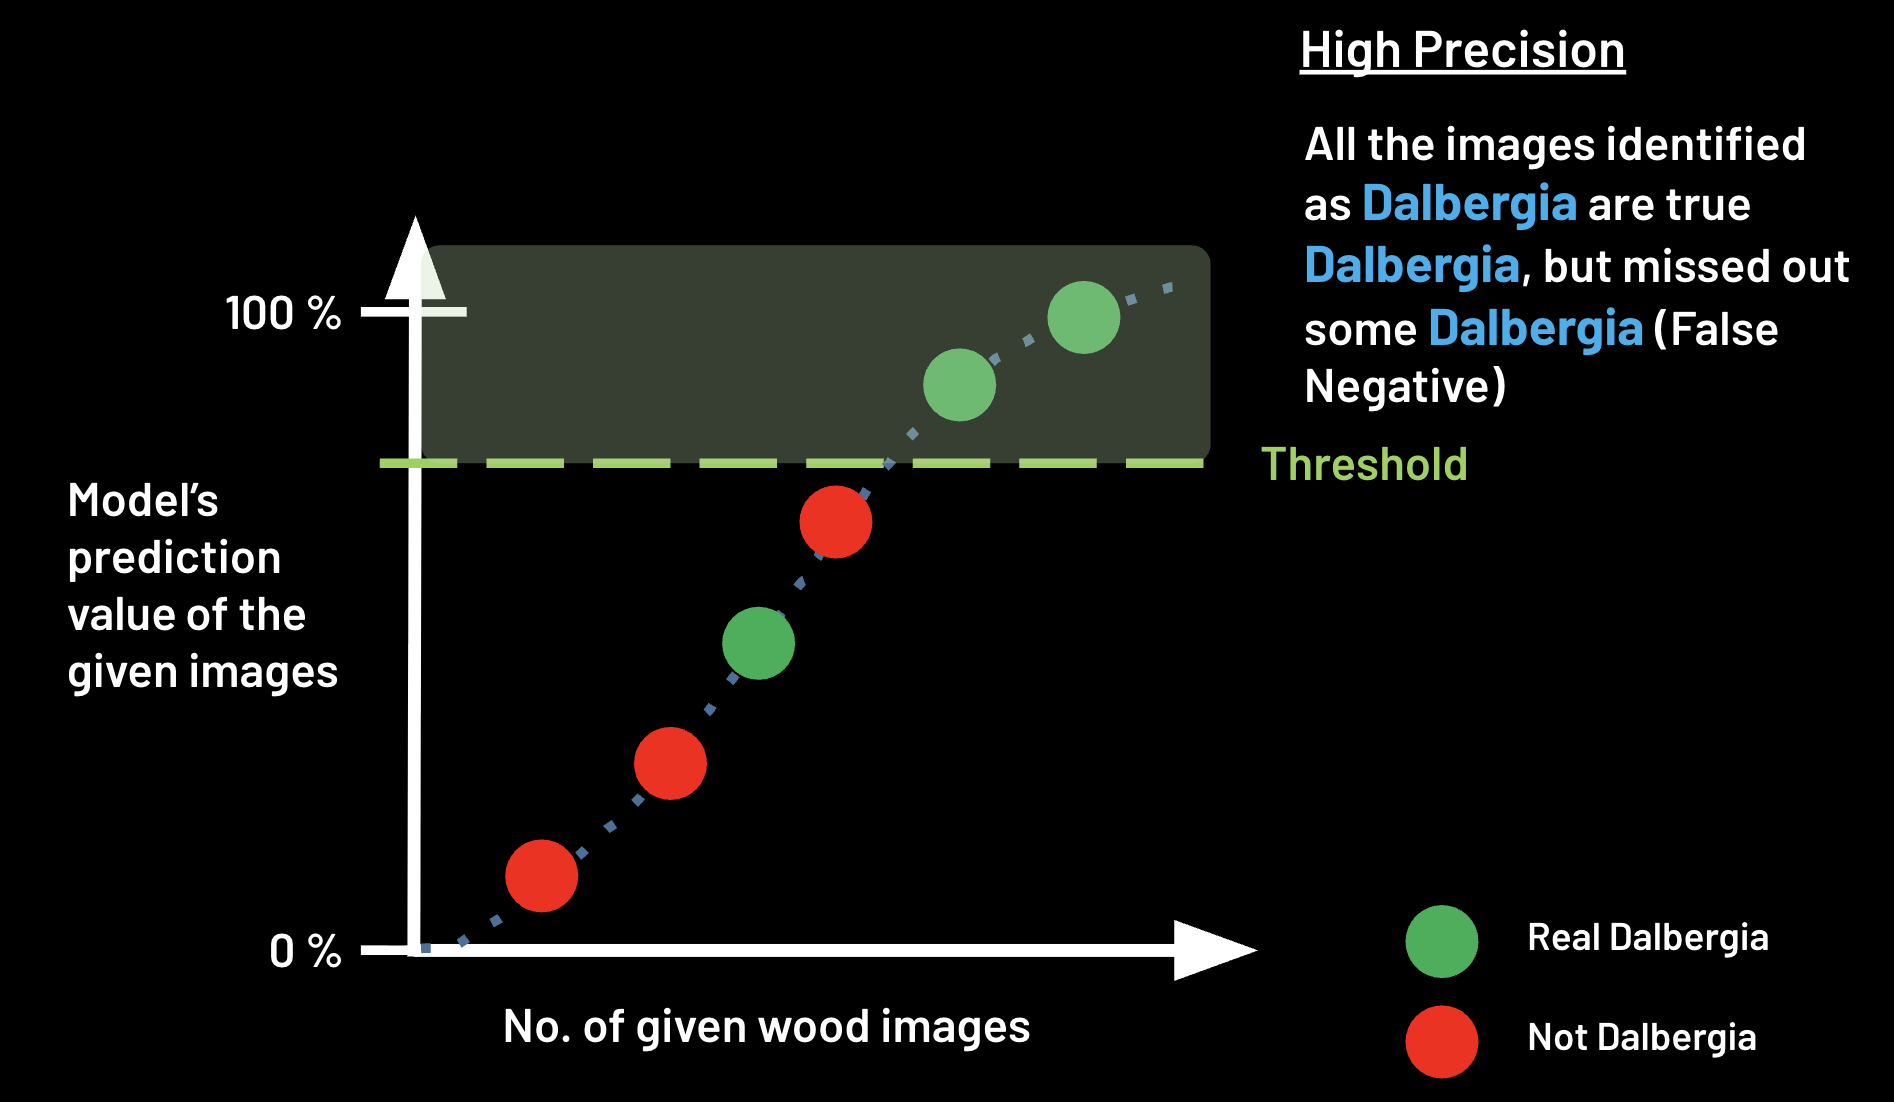
At a higher threshold value, the model will be more stringent in predicting positive images, meaning that only images with higher prediction values will be classified as positive.
This will result in higher precision (less false positives) but lower recall (more false negatives, i.e. more potentially missed positive images).
Lower Threshold Setting
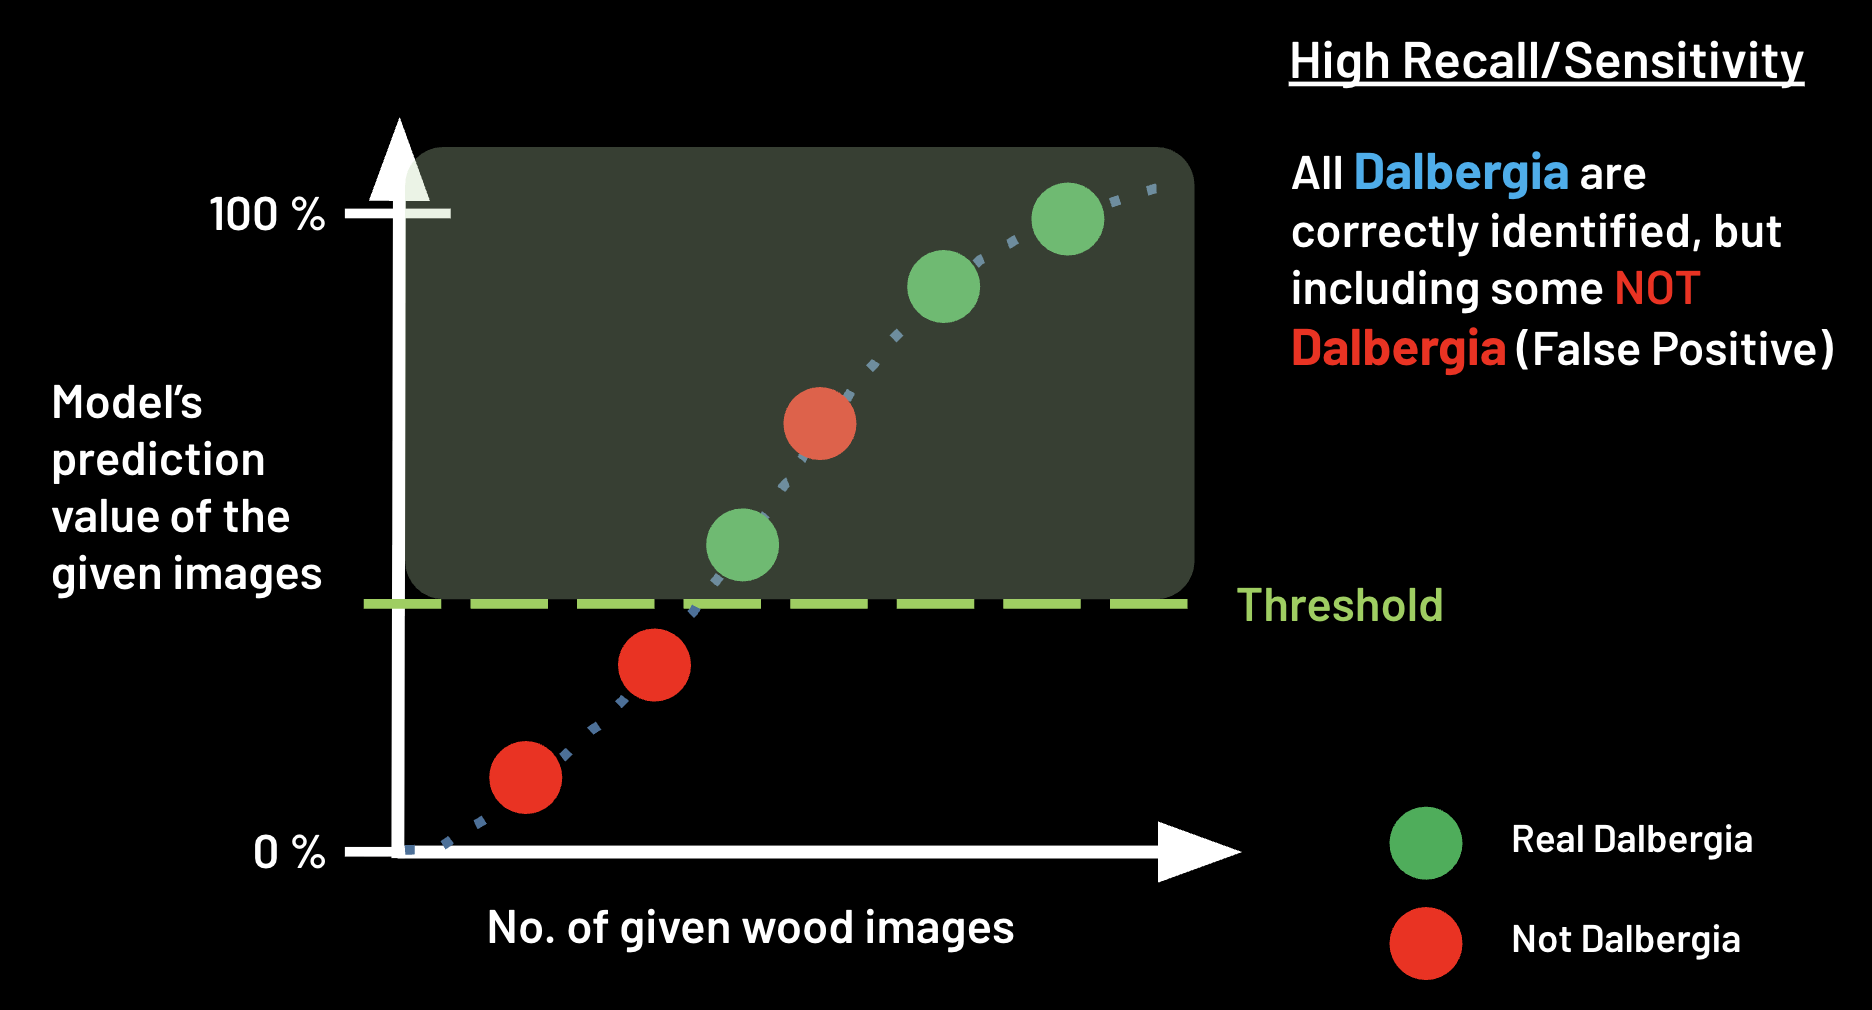
At a lower threshold value, the model will be more lenient in predicting positive images, meaning that more images with lower prediction values will be classified as positive.
This will result in higher recall (less false negatives) but lower precision (more false positives, i.e. more potentially negative images incorrectly classified as positive).